debugging analyze
分析崩溃
Fuchsia 在启动时启动一个名为 crashanalyzer 的程序,该程序报告程序崩溃并将崩溃线程的回溯打印到系统日志中。虽然您可以通过在运行时查看日志来直接浏览这些内容,但回溯内容是使用堆栈内存地址引用编码的,而不是指向程序源文件中的相应行。
```none {:.devsite-disable-click-to-copy}
[klog][I] devmgr: crash_analyzer_listener: analyzing exception type 0x108
[klog][I] <== fatal exception: process crasher[42410] thread initial-thread[42424]
[klog][I] <== fatal page fault, PC at 0x1e1888dbbbd7
[klog][I] CS: 0 RIP: 0x1e1888dbbbd7 EFL: 0x10246 CR2: 0
[klog][I] RAX: 0 RBX: 0x1 RCX: 0x721ad98697c6 RDX: 0x77accb36f264
[klog][I] RSI: 0 RDI: 0 RBP: 0x2781c4816f90 RSP: 0x2781c4816f80
[klog][I] R8: 0 R9: 0 R10: 0 R11: 0x246
[klog][I] R12: 0x773bf11dcda0 R13: 0x773bf11dcdd0 R14: 0x16 R15: 0x78050d69
[klog][I] errc: 0x6
[klog][I] bottom of user stack:
[klog][I] 0x00002781c4816f80: f11dcda0 0000773b 9ccd2b38 000039b2 |....;w..8+...9..|
[klog][I] 0x00002781c4816f90: c4816fd0 00002781 88dbbba7 00001e18 |.o...'..........|
[klog][I] 0x00002781c4816fa0: 00000008 00000000 9ccd2b38 000039b2 |........8+...9..|
[klog][I] 0x00002781c4816fb0: f11dcf70 0000773b f11dcf70 0000773b |p...;w..p...;w..|
[klog][I] 0x00002781c4816fc0: cb36f570 000077ac f11dcdd0 0000773b |p.6..w......;w..|
[klog][I] 0x00002781c4816fd0: c4816ff0 00002781 cb2b0d0f 000077ac |.o...'....+..w..|
[klog][I] 0x00002781c4816fe0: 00000054 00000000 f11dcf70 0000773b |T.......p...;w..|
[klog][I] 0x00002781c4816ff0: f11dcfe0 0000773b 00000000 00000000 |....;w..........|
[klog][I] arch: x86_64
[klog][I] dso: id=a94c78564173530d51670b6586b1aa471e004f06 base=0x7d3506a49000 name=libfdio.so
[klog][I] dso: id=a61961ba9776a67a00fb322af9ebbdcfd1ce3f62 base=0x77accb297000 name=libc.so
[klog][I] dso: id=760f1e6e47d3dd8b6a19150aa47241279ec75a9c base=0x721ad9863000 name=<!--
This is because the **debug symbols** are stripped out of the core binaries
by default at build time. To properly analyze the crash log, you need to
reapply those symbols to the backtrace to see the call stack in terms of source
code line numbers. When you call the `ffx log` command, the developer tools
process the raw log through an additional binary called `symbolizer` that
reapplies the symbols from your local build configuration to any backtraces in
the log.
-->
这是因为 **调试符号** 在构建时默认从二进制文件中删除。要正确分析崩溃日志,您需要将这些符号重新应用到回溯,以根据源代码行号查看调用堆栈。当您调用 `ffx log` 命令时,开发人员工具会通过一个名为 `symbolizer` 的附加二进制文件处理原始日志,该二进制文件将本地构建配置中的符号重新应用到日志中的任何回溯。
```posix-terminal
ffx log
您看到的输出包括重新应用于回溯的符号:
```none {:.devsite-disable-click-to-copy} [klog][I] devmgr: crash_analyzer_listener: analyzing exception type 0x108 ... same output as "raw" backtrace ... start of symbolized stack: [klog][I] #01: blind_write at ../../src/developer/forensics/crasher/cpp/crasher.c:21 [klog][I] #02: main at ../../src/developer/forensics/crasher/cpp/crasher.c:137 [klog][I] #03: start_main at ../../zircon/third_party/ulib/musl/src/env/__libc_start_main.c:49 [klog][I] #04: unknown, can't find pc, sp or app/library in line end of symbolized stack
<aside class="key-point">
<!--
If you have a manually captured backtrace, you can run the same process by
passing the content through the <code>ffx debug symbolize</code> command.
-->
如果您有手动捕获的回溯,则可以通过 <code>ffx debug symbolize</code> 命令传递内容来运行相同的过程。
</aside>
<!--
With a properly symbolized backtrace, you can directly discover the site of a
crash in your source code.
-->
通过正确符号化的回溯,您可以直接在源代码中发现崩溃的位置。
<!-- ### Step-through debugging -->
### 逐步调试
<!--
Just knowing where a program crashed may not be enough information to fully
diagnose the issue. Sometimes it's necessary to walk through the code
step-by-step and even inspect the state of variables in memory. To support this,
Fuchsia has a debugger for core code called `zxdb`.
-->
仅仅知道程序崩溃的位置可能不足以完全诊断问题。 有时需要一步一步地遍历代码,甚至检查内存中变量的状态。 为了支持这一点,Fuchsia 有一个名为 `zxdb` 的核心代码调试器。
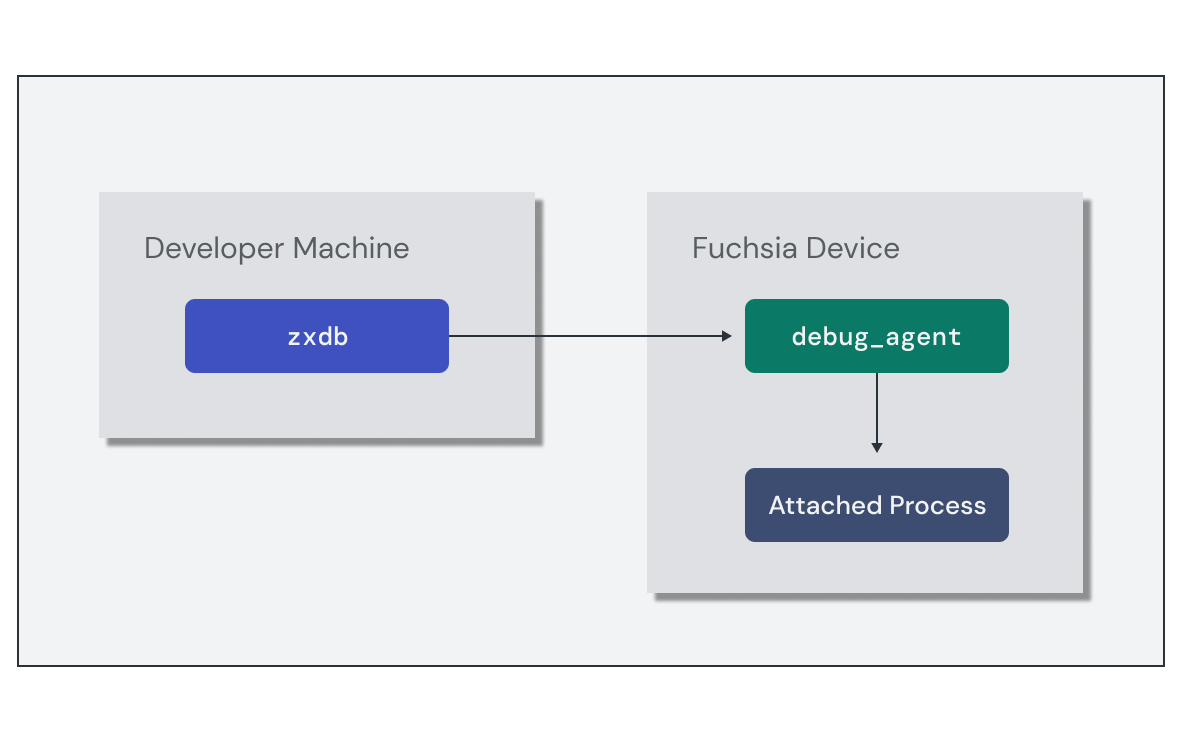
<!--
The `zxdb` tool is a client that connects to a running `debug_agent` component
on the target device. You can use the `zxdb` commands to configure the
`debug_agent` to attach to specific processes and set breakpoints. Once a debug
session is attached to a running process, `zxdb` allows you to step through the
code and inspect the stack frames.
-->
`zxdb` 工具是一个客户端,它连接到目标设备上正在运行的 `debug_agent` 组件。您可以使用 `zxdb` 命令进行配置,然后使用 `debug_agent` 附加到特定进程并设置断点。一旦调试会话附加到正在运行的进程,`zxdb` 允许您单步执行代码并检查堆栈帧。
<!--
{: width="591"}
-->
{: width="591"}
<!-- Setting up the debug session requires the following high-level steps: -->
设置调试会话需要以下高级步骤:
<!--
1. Run the `debug_agent` component on the target device.
1. Run the `zxdb` client and connect to the target device.
1. Set the location for `zxdb` to find debug symbols.
-->
1. 在目标设备上运行 `debug_agent` 组件。
1. 运行 `zxdb` 客户端并连接到目标设备。
1. 设置 `zxdb` 的位置以查找调试符号。
<!--
The simplest method to start a debug session is to use the `ffx debug connect`
command, which does all of these in the context of your local Fuchsia build.
However, these steps can also be performed manually if you need to configure
them separately.
-->
启动调试会话的最简单方法是使用 `ffx debug connect` 命令,该命令在本地 Fuchsia 构建的上下文中执行所有这些操作。然而,如果您需要单独配置这些步骤,也可以手动执行。
<!--
Once the debug session is active, you are taken to a `[zxdb]` prompt to issue
debugger commands. You can use `zxdb` to configure the `debug_agent` to attach
to a process using a name filter and set pending breakpoints even if no
matching process is currently running.
-->
一旦调试会话处于活动状态,您将被带到 `[zxdb]` 提示符以发出调试器命令。您可以使用 `zxdb` 来配置 `debug_agent` 以使用名称过滤器附加到进程,并设置挂起断点,即使当前没有匹配到正在运行的进程。
<!--
The following example sets a pending breakpoint on main to stop at the
beginning of execution, and waits for a process called "hello-world" to start:
-->
以下示例在 main 上设置一个挂起的断点以在执行开始时停止,并等待名为“hello-world”的进程启动:
```none {:.devsite-disable-click-to-copy}
[zxdb] attach hello-world
Waiting for process matching "hello-world"
[zxdb] break main
Breakpoint 1 (Software) on Global, Enabled, stop=All, @ main
Pending: No matches for location, it will be pending library loads.
将调试器附加到进程后,您可以使用 zxdb 命令来控制和检查进程的状态。以下是常用命令的简短集合:
注意:关于 zxdb 命令的完整详细信息和参考,请查看 Fuchsia 调试器。
step
|
步过线程中的下一行代码 |
next
|
步入线程中的下一行代码 |
continue
|
继续执行直到下一个断点、异常或退出 |
frame
|
列出或从当前堆栈帧中选择 |
print
|
求表达式的值并打印结果 |